


 147 / 308

147
Space Propulsion
tion such as the necessity to not only resolve the velocity
and temperature boundary layer to values smaller than y+
< 1 but take into account the finite rate chemistry in suffi-
cient detail which have been missing in almost all numer-
ical tools applied so far for such applications. This finding
is an outcome of a modeling workshop with international
participation of renown experts such as the Japanese
Space Agency (JAXA) and the Ariane Group particularly
dedicated to identify strengths and weaknesses in
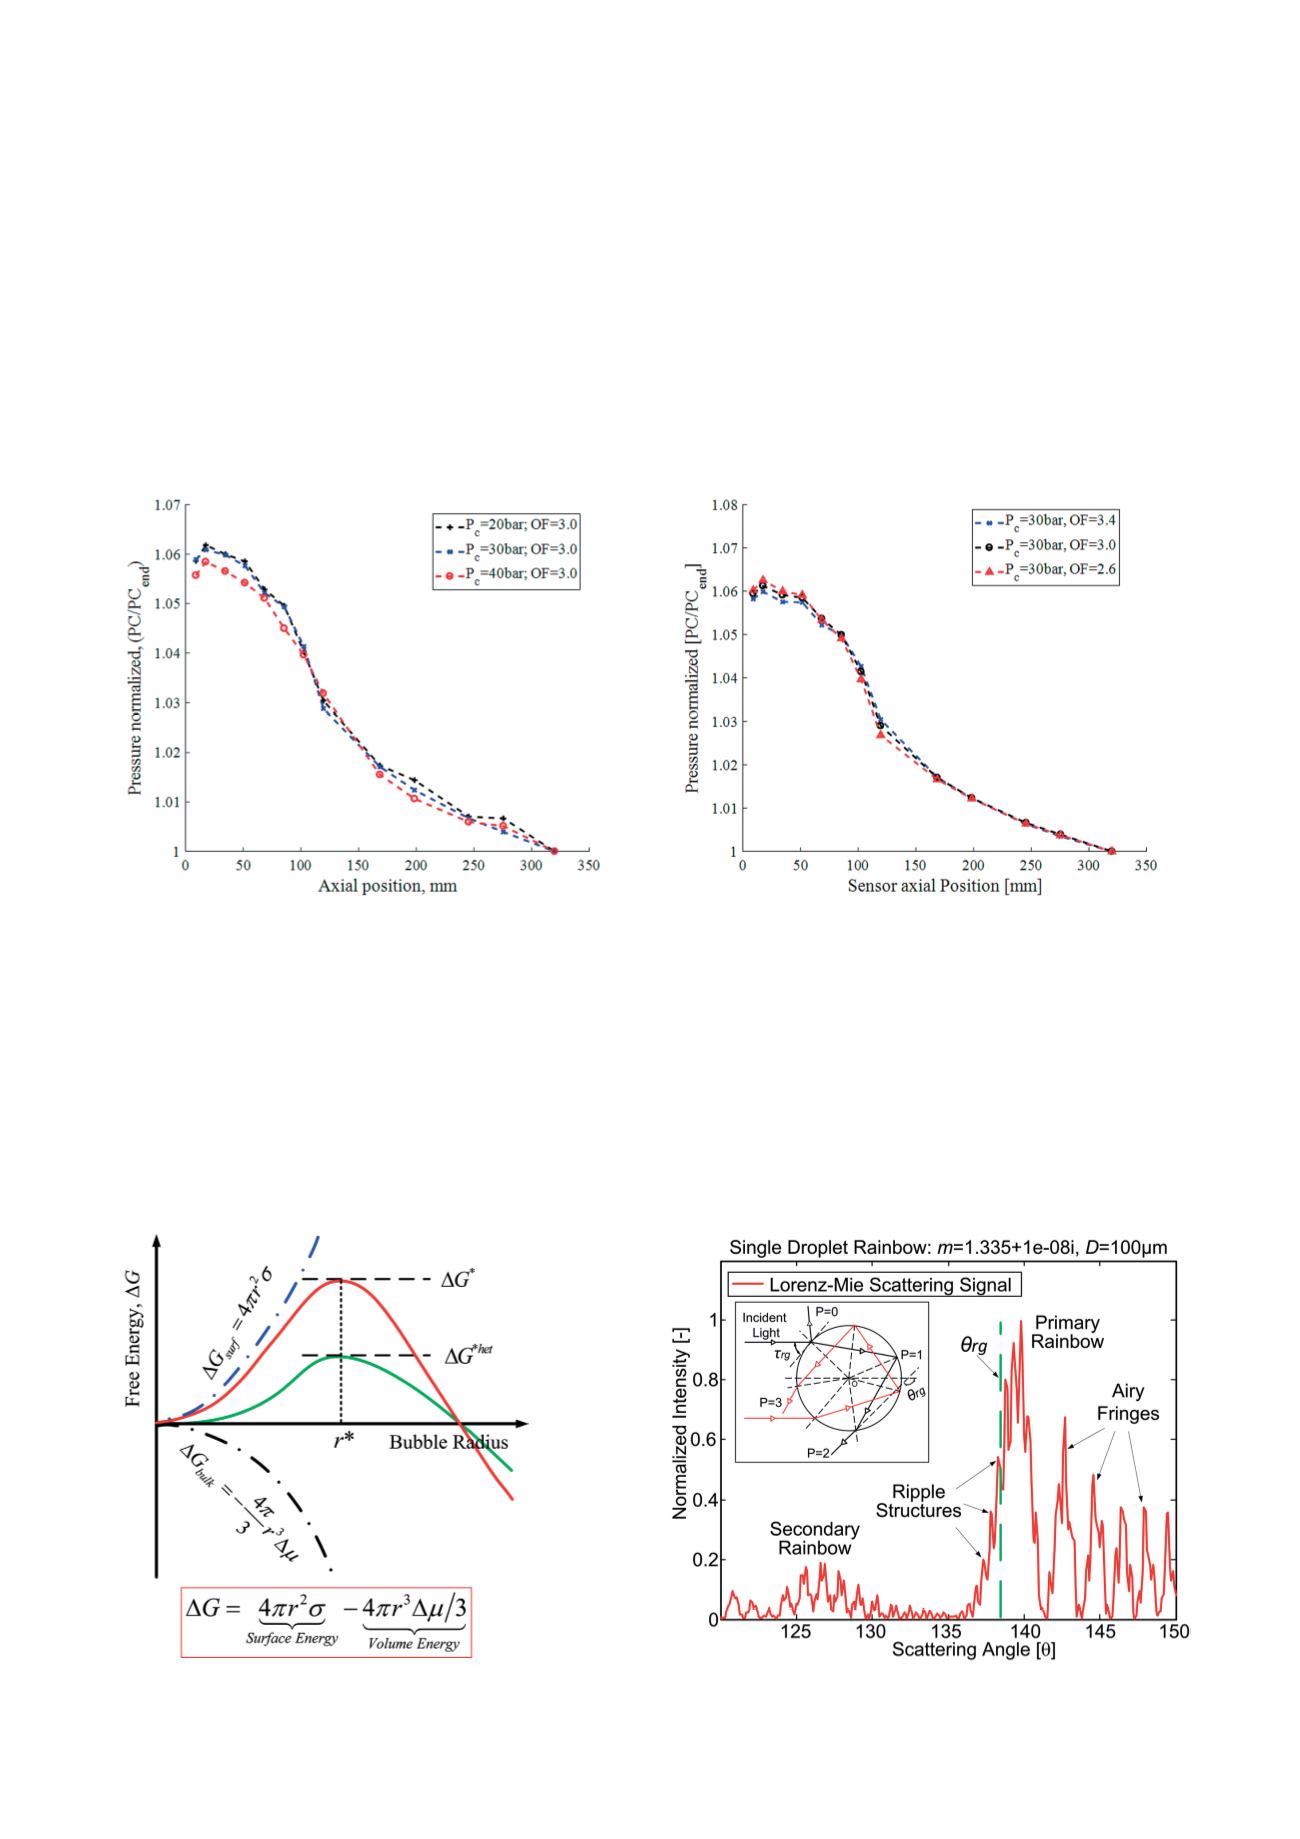
Figure 6: Normalized axial pressure distributions in a 7-injector model combustion chamber for a) 20 and mixture ratios of 2.6, 3.0 and 3.4
and b) 20bar, 30 bar and 40 bar for a mixture ratio of 3.0
numerical models and tools. Fig. 5 demonstrates the tem-
perature stratification in the combustor but shows as well
the majority of the heat release has already taken place
within the first 200 mm of the combustion chamber, a fact
which is validated by the wall pressure profiles, see Fig. 6,
where after the steep decrease within the first part of the
chamber, the rate of decrease becomes nearly constant
after 200 mm.
Technologies for Green In-Space Propulsion
A key problem of in-space propulsion systems is the
transient start-up period of such thrusters since during the
first phase the propellants are injected into the combustion
chamber at very low pressures which enforces flash vapori-
zation of the fluids since although at cryogenic temperatures
the propellants are in a state superheat, see Fig. 7 which
shows the nucleation barrier as a function of the bubble
diameter and the rainbow signal of a single droplet.
Figure 7: Nucleation barrier ΔG (left) and rainbow scattering signal of a single droplet (right)